Artificial intelligence for the Orbe
The Orbe Catchment
The Orbe River is a mountainous river located in the Jura Mountains of Switzerland, flowing through the canton of Vaud. With a length of approximately 43 kilometers, it originates from the Vallée de Joux and exhibits typical characteristics of a mountain river, including steep gradients, rocky substrate, and fast-flowing waters. The river is fed by mountain springs and snowmelt, resulting in relatively low sediment load and clear waters. The upper Orbe features the Lac de Joux and Lac Brenet, which have a significant capacity to store water and regulate flows. Along the Orbe River there are several hydropower schemes that produce carbon-free electricity.
Hydrological forecasting is important to prepare against floods and to optimize hydropower production. Performing accurate forecasts is, however, not always easy.
The hydrological behavior of the Orbe River is extremely difficult to predict due to the presence of Karst systems undergroud. Karsts are typically associated with soluble rocks such as limestone, dolomite, and gypsum. Often, the Karst geology leads to the formation of underground drainage systems that act as pipes and reservoirs. In these conditions water can travel very fast underground and, unless the system is known in detail, the relationships between rainfall, snow melt, lake levels, and discharges downstream can be difficult to understand.
Why artificial intelligence
Because of the Karstic nature of the Orbe Catchment, classical hydrological models that transform rainfall into discharge struggle to produce accurate predictions. Artificial intelligence models are not limited to the hydraulic and hydrological equations introduced in classical models and are, therefore, more flexible to adapt to unusual situations. Artificial intelligence models can learn very complex relationships directly from observed data (in this case records of discharge, water levels, rainfall, snow accumulation, and temperature). The Tethys Forecasting System is a state-of-the-art forecasting tool that employs artificial intelligence to achieve great reliability and adaptability. It can harness the power of deep neural networks to cope with the complex Karstic behavior of the Orbe.
This website
More information and details about the system can be found below or with the help of the menu on the left. The data and forecasts can be accessed from the map or, perhaps more conveniently, using the dashboard.
The information shared in this site is sensitive. Please log in before going into a restricted area.
Technical details
The website
The Tethys Forecasting System is based on open-source technology. Its base programming language is Python, which offers the almost unique possibility of using a single language to program the data manangement and visualisation tool (the website) and the scientific code required to prepare and run the forecasts. The database behing Tethys is MySQL and Tethys itself runs on a Django web server. To speed things up, the code at the heart of the forecasting system was written in openCL are performed in parallel using a Graphics Processing Unit (instead or in parallel to multiple CPU cores). With this, years-worth of probabilistic forecasts can be computed in a matter of seconds.

Data
The system operates based on numerical weather forecasts and ground stations. The weather forecast data comes from the Global Forecasting System (GFS) by the USA National Atmospheric and Oceanic Agengy (NOAA) and other sources. The forecasts go up to 16 days and are retrieved daily at a resolution of 0.25x0.25 deg.
Discharge and water level data are obtained from gauging stations on the ground.
Hydrological modelling
The forecasts produced by Tethys can rely on artificial intelligence, deterministic conceptual hydrologic models, or a mix of both, reaping the best of what the conceptual and data-driven modelling approaches have to offer.
Probabilistic forecasting
Probabilistic forecasting extends the traditional deterministic approach by associated uncertainty (i.e., potential errors) with every prediction.
Doing so is not straightforward because the error is not always the same. Predictive errors of hydrological series in particular are affected by issues such as heteroscedasticity (errors are usually greatest during high flows), non-normality (often hydrological probability distributions differ from the Gaussian distribution), or autocorrelation (errors in consecutive timesteps are usually related, meaning that errors cannot be considered independent). Such features render the implementation of analytical solutions for probabilistic forecasting impractical.
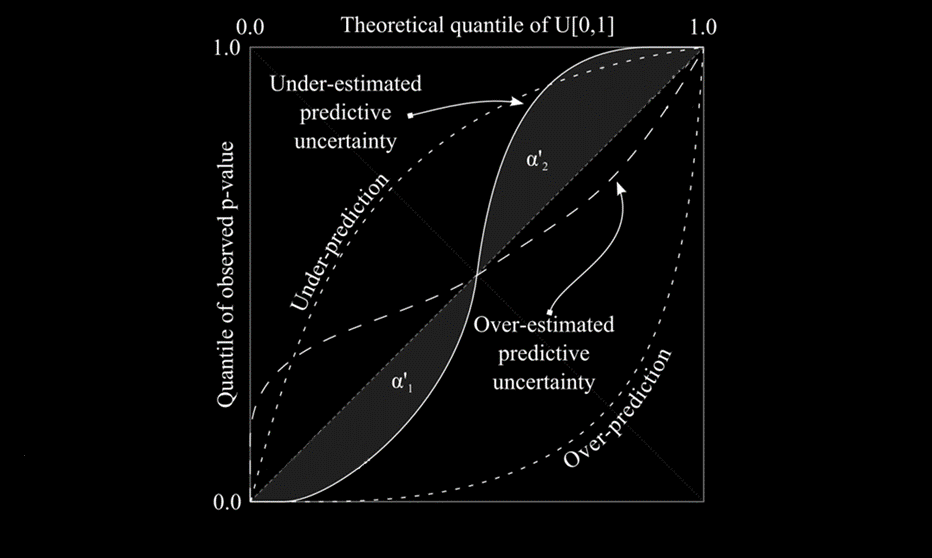
The previous points do not mean that attempts at estimating uncertainty are not usually made. In fact, recognizing its importance, operational forecasting systems often include ways to model uncertainty. In most cases, however, such efforts are computationally expensive and bounded by important modeling assumptions, leading only to rough estimations. Fortunately, it is easy to assess whether a probabilistic prediction is reliable or not. One way to do this is by computing a predictive quantile-quantile plot (see example below). In a predictive quantile-quantile plot, a statistically reliable prediction will fall on a diagonal line. Departures from that line indicate discrepancies between observations and the prediction and can be used to learn what may be wrong with the model.
Generalized Pareto Uncertainty
The probabilistic forecasting capabilities of Tethys are its distinguishing feature. The Generalized Pareto Uncertainty algorithm used by Tethys does not assume much about the process being simulated, learning everything it needs to know from historical data. Due to this, a large array of variables can be predicted if there is a sufficiently long historical series available (preferably 10 years or more).
GPU works by combining a very large number of regression models to produce its probabilistic forecasts. Each one of these regression models is a deterministic function of the type y=f(X, W), where X represents several input variables that may be used as inputs, and W is a matrix of model parameters. For example, we may want to predict discharge one week from now based on today's observations of discharge, temperature, and precipitation; that would look something like this: Qt+7=f([Qt, Tt, Pt], W).
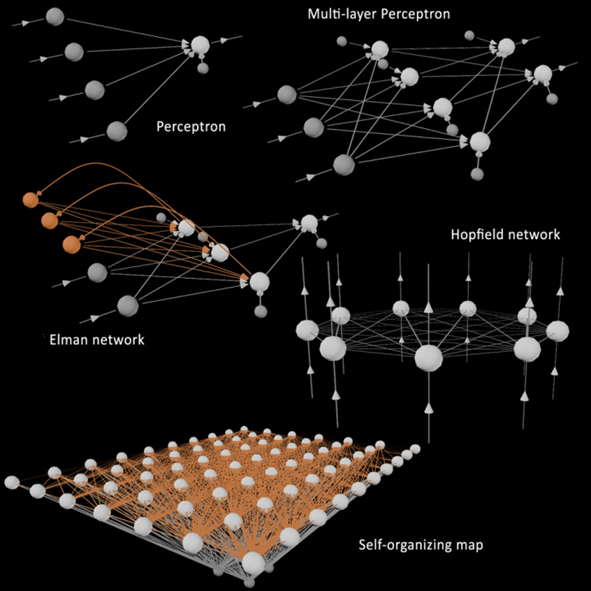
The choice of an adequate regression model depends on the problem at hand. To keep things general, an allowing Tethys to predict a wide range of variables, artificial neural networks were chosen. Artificial neural networks are machine learning or artificial intelligence models that come in different shapes and sizes (see figure below). In Tethys, the multi-layer perceptron type was chosen. These models emulate the human brain at a sub-symbolic level. Based on layers of "neurons" and the "synapses" connecting them, multi-layer perceptrons can be trained with historical observations and learn to predict the behavior of complex systems.
But that was only one model. For a probabilistic prediction the Generalized Pareto Uncertanty combines thousands of such models, each with its own specific parameters (W). The key is to find the adequate parameters for each regression model f. The Generalized Pareto Uncertanty uses a custom multi-objective optimization code that aims for:
1) each prediction being as close as possible to observations;
2) creating regression models that make predictions between always below obsevations to always above them.
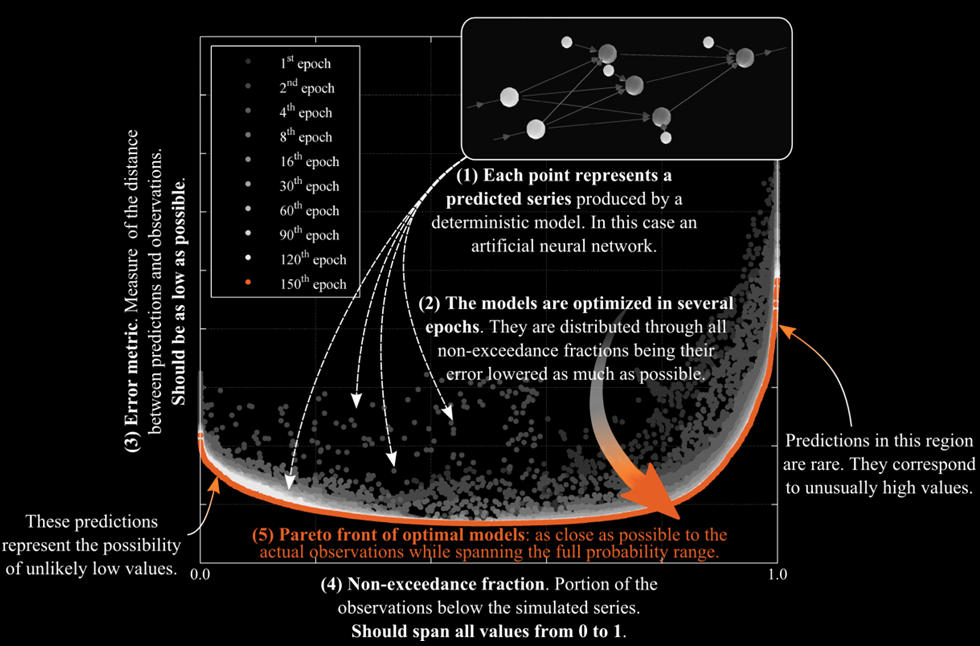
The training process is rather complicated (follow this link for further information), but it can be summarized in the figure below. In the figure, each point represents a regression model (in this case an artificial neural network). The x-axis represents non-exceedance, which can be related to probability. For example, a non-exceedance of 0 means that, for the historical data set used to train the models, predictions were never exceeded by observations. Conversely, a non-exceedance of 1 is obtained when historical predictions have consistently been above observations. In order to guarantee that, for all non-exceedances, predictions are as close as possible to observations, it is important to account for the error associated with each model (y-axis). Trough several epochs (or iterations) of training, the Generalized Pareto Uncertainty algorithm will find the sets of parameters that allow the many regression models to cover the full range of non-exceedances (from 0 to 1) with as little error as possible.
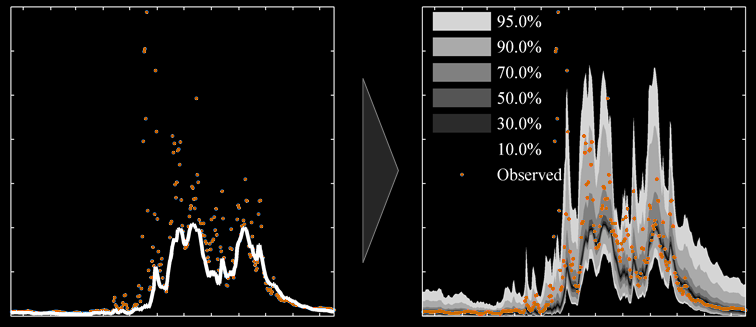
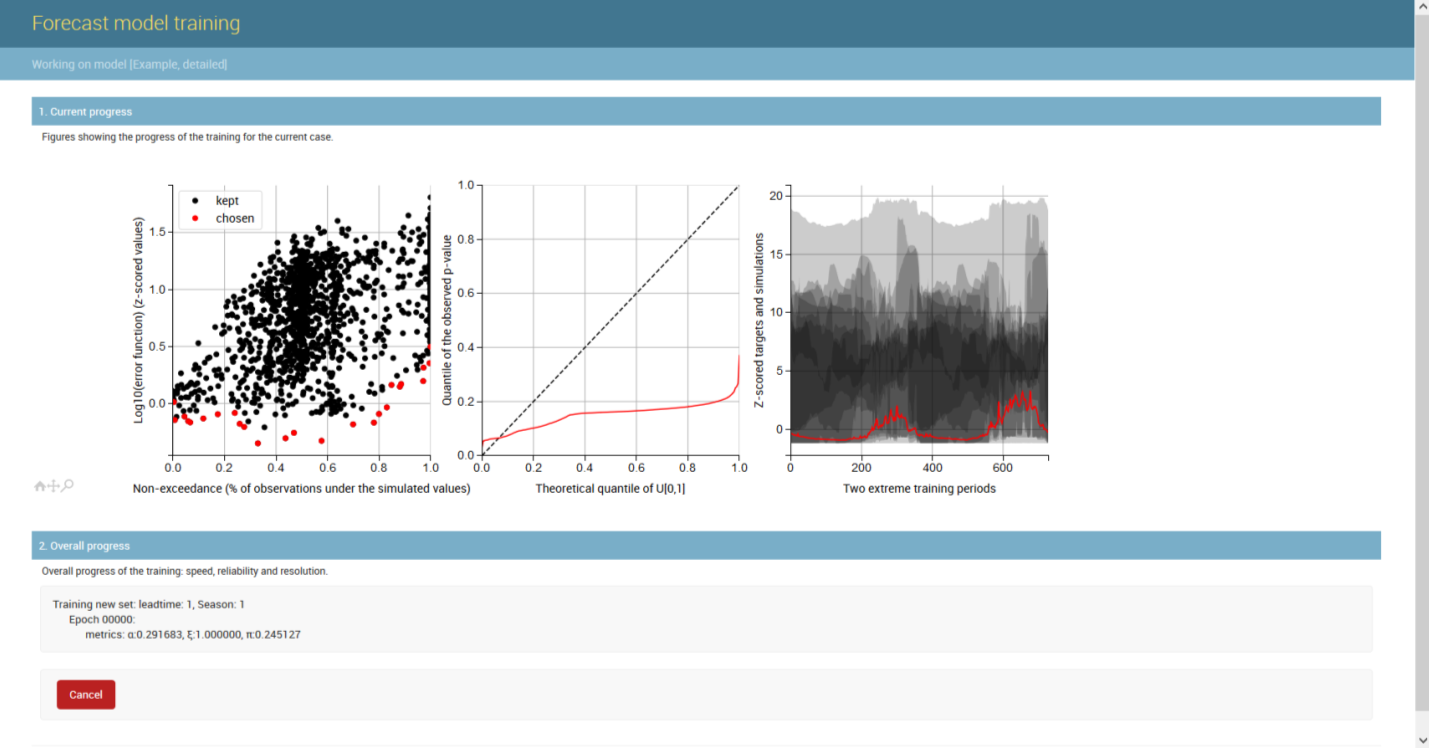
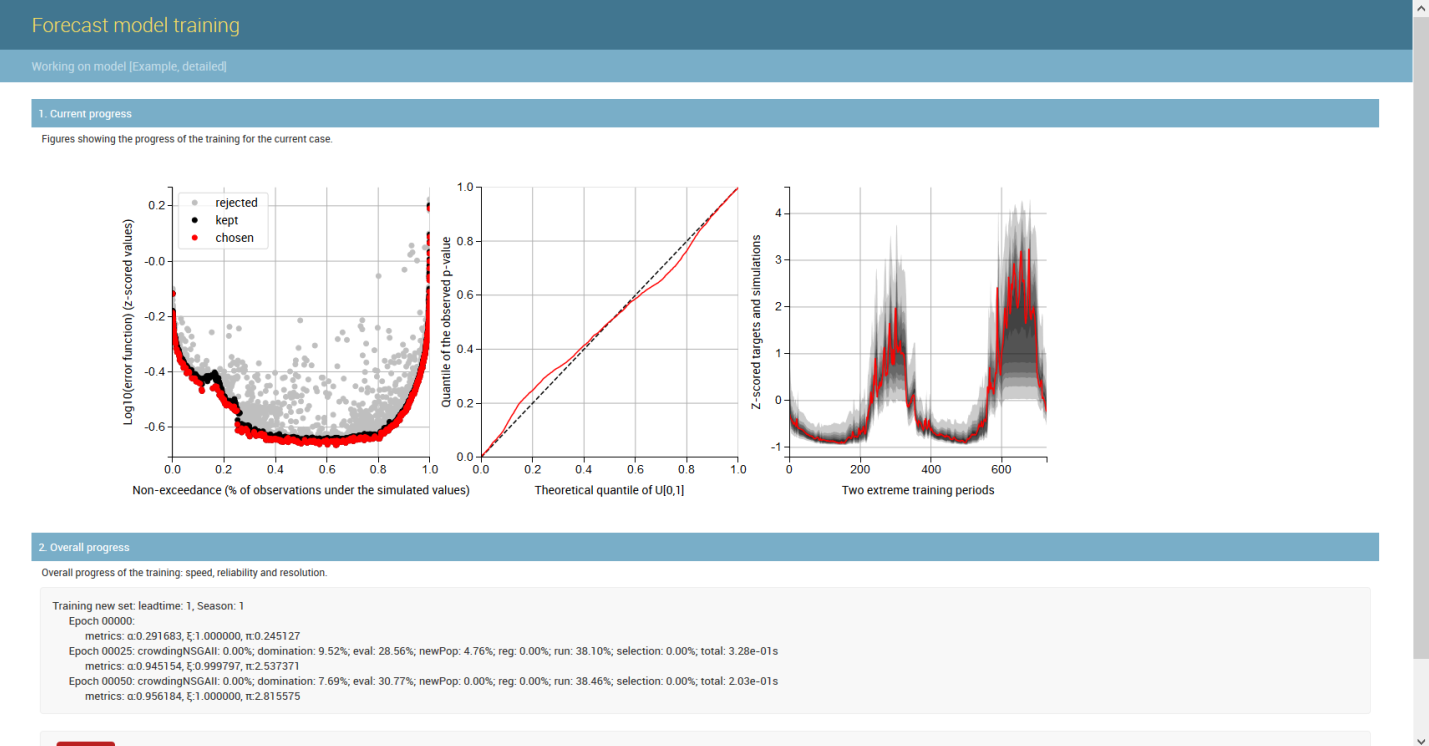
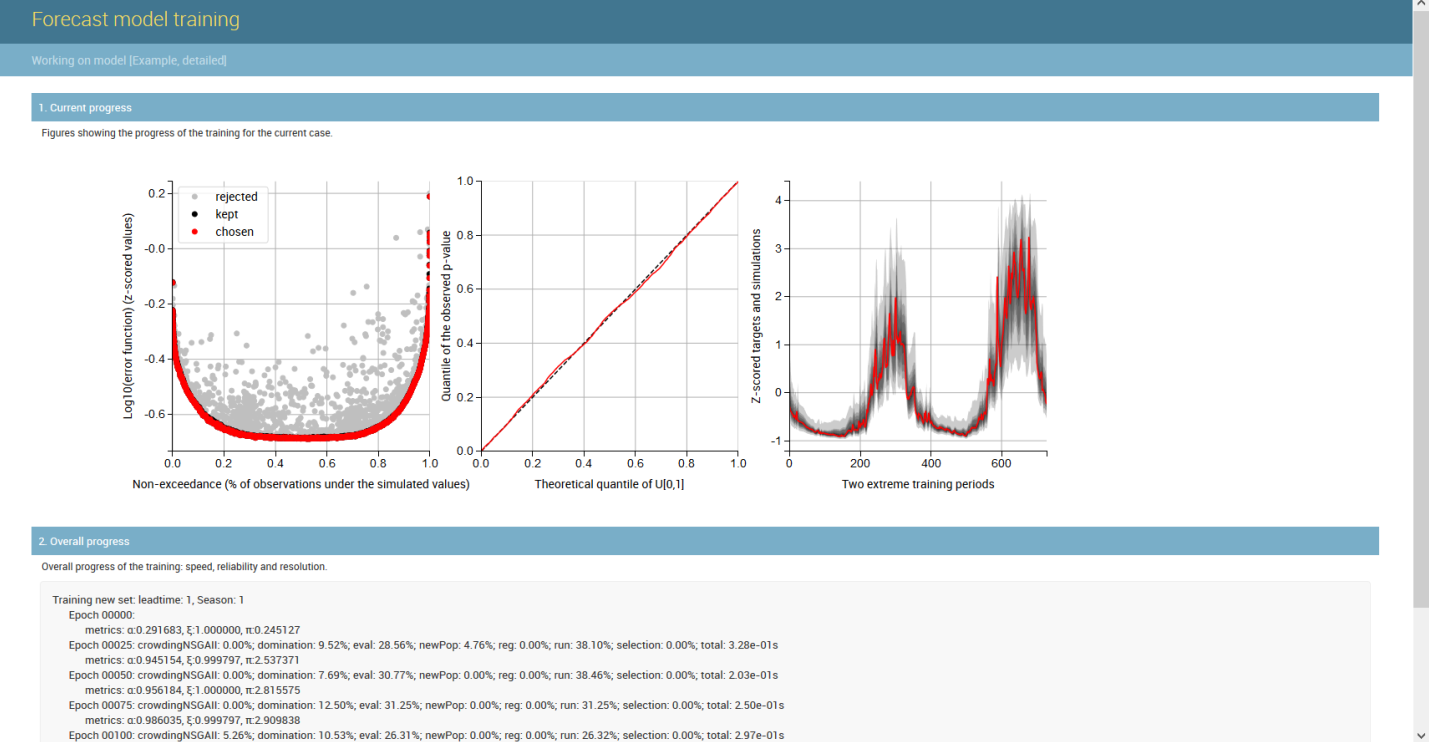
An example of the Generalizing Pareto Uncertainty model in the operation is shown below, where three figures illustrate the start, middle, and end phases of model training. On the left plot the non-exceedance vs. error plane is portrayed; in the middle, the quantile-quantile plot is displayed (perfect reliability along the diagonal); and on the right plot the time series is shown (obsevations in red, probabilistic predictions in shaded gray). When the training starts predictions are very bad (right plot) reliability is poor (middle plot). As the training progresses (second figure), better parameters for each artificial neural network are found and predictive error is reduced (right plot). Also, reliability is dramatically improved (middle plot) and predictions become much better (right plot). When training is allowed to continue (third figure), the optimal parameters of reach artificial neural network will be found (left plot). Reliability will typically be excellent (middle plot), and the uncertainty associated with the predictions is further reduced (right plot).
About
Development of the forecasting system
The Tethys Forecasting System was developed at the École Polytechnique Fédérale de Lausanne (EPFL), in Switzerland, as part of the ADAPT Database research project. The initial development has been financed by the Swiss Competence Centre Environment and Sustainability (CCES) and EPFL. It aimed to produce reliable long-term hydrological forecasts for the Zambezi catchment in Southern Africa, a region where the hydrometric monitoring network is relatively sparse. Since its inception the system has been successfully applied in temperate and cold climates.
Today, the system is maintained and developed by Gruner AG and the Instituto Superior Técnico of the University of Lisbon.
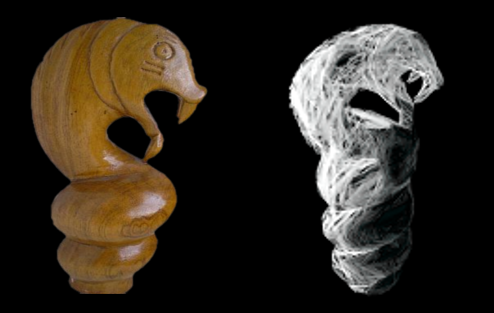
The logo
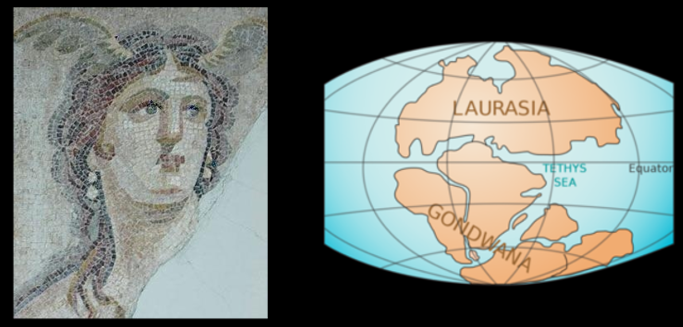
The logo is inspired on the representation of Nyami Nyami, the Zambezi River God of the Tonga, an ethnic group living mostly in Zambia and Zimbabwe, in the region of the Kariba Dam. It was at this location that Tethys was first tested.
The name
The name of the system - Tethys - has a double relationship with its purpose and history. Firstly, Tethys is a titan in Greek mythology know to be the mother of the greek river gods. Secondly, Tethys gave her name to the Tethys Ocean which, when the dinosaurs still roamed the earth, bathed the eastern shore of the Gondwana Continent (and thus ancient Africa). The fact that Tethys is historically connected to rivers and that the Zambezi drained to the Tethys Ocean inspired the name choice.